Introduction
"Let the buyer beware" is the kind of phrase that comes to mind in conjunction with buying a used car, not when buying food. However, Allison, Heshka, Sepulveda, and Heymsfield (1993) think that this phrase should apply to purchasing "diet" and "health" foods as well. They discovered that some labels on food packages understated the calorie content by more than 85%.
Synopsis
Abstract
The differences between the calorie content reported on labels and the calorie content measured in the lab are examined for 40 foods marketed as “diet,” “low-fat,” or “health foods.” Also included in the data is whether the product is “nationally advertised,” “regionally distributed,” or “locally produced.”
Data Set
4 variables, 40 cases
6 Questions
Random errors, advantages and disadvantages of different methods of reporting data, populations, graphical analysis, numerical summaries, looking for patterns, hypothesis testing, skewed distributions.
Basic: Q1-6
Protocol
Allison, Heshka, Sepulveda, and Heymsfield (1993) carried out a survey of 40 food items claiming to be "lite," "reduced-calorie," "low-calorie," "diet," "low-fat," "no-fat," or "health" foods. All food was purchased in Manhattan, New York from January through August 1992. The foods were classified based on their distribution as either nationally advertised, regionally distributed, or locally prepared. "Nationally advertised" meant the food had brand names familiar to the investigators and were bought at a major supermarket. Foods "not made by a company the investigators recognized from national advertising were considered to be regionally distributed" (p. 1454). "Locally prepared" meant the food was manufactured or prepared by the vendor.
The foods' caloric contents were measured by bomb calorimetry.![]() Bomb Calorimetry:The process of measuring the heat (calories) produced by burning a fuel completely in pure oxygen. Four foods had labels that couldn't be removed, but in all other cases the technicians were blind to the foods' labeled caloric contents. The bomb calorimetry readings were converted into an estimate of total metabolizable energy, the type of energy the calories on a food label are supposed to reflect.
Bomb Calorimetry:The process of measuring the heat (calories) produced by burning a fuel completely in pure oxygen. Four foods had labels that couldn't be removed, but in all other cases the technicians were blind to the foods' labeled caloric contents. The bomb calorimetry readings were converted into an estimate of total metabolizable energy, the type of energy the calories on a food label are supposed to reflect.
Data
The following variables are contained in the stored data:
Food = kind of food
Per gram = percentage difference between measured calories and labeled calories per gram (100% x (measured – labeled)/labeled)
Per item = percentage difference between measured calories and labeled calories per item
Classification = N if nationally advertised, R if regionally distributed, L if locally prepared
Questions
If the errors in reporting the number of calories in food were random and unbiased, how would you expect the number of overreported values to compare to the number of underreported values?
If the errors were random then we would expect about an equal number of overreported values and underreported values.
This data is reported in terms of percent difference in caloric content. The data could also have been reported with two variables: labeled calories and measured calories. Which method of reporting the data would you prefer and why?
Having the labeled and measured number of calories is preferable because from these the percentages can be computed. If a certain food only claimed to have 1 calorie but actually had 2 calories then the difference will appear to be 100%, but another food which claimed to have 100 calories and really had 101 calories will register only a difference of 1%. Both of these are underreported by one calorie, but in some uses, such as dieting, the actual number of calories underreported may be more meaningful than the percentage difference.
To what population are the results of this study applicable? What steps might the researchers have taken to make the study more widely applicable?
A population to which this study extends is that of the diet and health food products purchased for this study. To extend the conclusions to a wider geographic area and to the whole population of diet foods, some sort of random sampling design should be used.
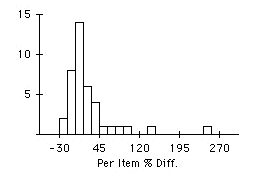
Examine the percent difference between measured and labeled calories per item variable. Describe the shape of the distribution of this variable. What is the most appropriate measure of a typical value from this distribution?
Here is a histogram of the number of foods with the indicated per item percent difference between the measured and labeled calories. The distribution is highly skewed, with a long right tail. The best measure of a typical value from this data is the median, because of the skewness.
a) Does there appear to be any evidence of a systematic pattern in the difference between measured and labeled values of calories per item?
b) Can the difference between the measured and labeled values be explained by chance variation in the measuring process? Carry out an appropriate test to examine this question.
a) Yes, there seems to be a tendency to underrepresent the calories. The median is greater than zero, which tells us that the measured values were generally greater than the labeled values.
b) An appropriate test is the one-sample sign test of
H0: Median = 0 versus Ha: Median > 0.
From the data:
Total Observations: 40.
Observations of 'Per item' > 0: 30.
Ties: 0.
Since the P-value = 0.0011, we reject H0. This confirms the conclusion of Part a: there is a tendency to underrepresent the caloric content of the products in this study.
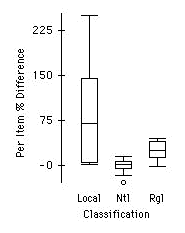
Use graphical or numerical summaries to examine the difference in measured and labeled calories per item according to whether the item is nationally advertised, regionally distributed, or locally prepared. Summarize your findings.
These boxplots suggest that national products are not systematically underreporting caloric content, regional products are somewhat underreporting, and local products are most prone to underreporting. There is also an increase in the variability as the classification changes from local to regional and national.
References
Allison, D., Heshka, S., Sepulveda, D., and Heymsfield, S. (1993)
Credits
This story was prepared by Rebecca Busam and last modified by Kathleen Fritsch on 4/5/94.