

Introduction
Stress is a fact of everyday life. Allen, Blascovich, Tomaka, and Kelsey (1991) explored how the presence of others can affect certain stress indicators when a person performs a stressful task. In this study, the researchers asked forty-five women to perform mental arithmetic in the presence of their pet dog, a good female friend, or alone. To record the participants' stress levels during the task and rest periods, the experimenters measured blood pressure, heart rate, and skin conductance response. The researchers were interested in exploring whether the fact that a human friend could evaluate the subject's performance at arithmetic while a dog could not would affect the participant's stress level.
Synopsis
Abstract
This story reports on an experiment to study whether pets reduce stress in their owners. Forty-five women were asked to perform mental arithmetic tasks either alone, with a friend, or with their pet dog while blood pressure, heart rate, and skin conductance were measured.
Data Set
Repeated measurements of several variables.
Extensions
Project idea.
6 Questions
Controls in experiments, summary statistics, time series plots, histograms.
Basic: Q1-6
Protocol
This experiment was performed in the greater Buffalo, New York area. Forty-five women who were self-professed "dog lovers" volunteered for the experiment. The experiment was conducted in two parts. In the first part the women came to the laboratory at the State University of New York at Buffalo. The laboratory served as a control setting; neither the pet dogs nor the friends of the subjects were present at the laboratory. In the lab the women were asked to perform two mental arithmetic tasks with five minute rest periods before and after each task. Additional time was allotted for instructions to be given before each task. The first task was to count backwards out loud by 3's from a four digit number for two minutes. The second task was similar, except the subjects were asked to count backwards by 7's. During this session the participant's heart rate and skin conductance response were recorded every twenty seconds. Blood pressure was also recorded once during each of the task and rest periods. During this laboratory session, the only person in the room with the subject was an experimenter monitoring the equipment behind the subject. Instructions for the tasks were played from a tape recorder.
The second part of the experiment was conducted in the subject's home, about two weeks after the laboratory session. For this session the subject was randomly assigned to one of three conditions: to have her dog, a close personal friend, or only the experimenter present. During the experiment, all family members and dogs that were not participating were asked to leave the premises. This session was similar to the laboratory setting except the women were asked to count backwards by 13's and 17's instead of 3's and 7's. In the pet present condition no attempt was made to constrain the dog's movement within the room. In the friend present condition, the friend sat in a chair to the left and at a 90° angle to the subject. The friend was instructed to be supportive in any manner she chose. In all three cases, the experimenter again sat behind the subject monitoring the recording equipment.
The heart rate, skin conductance response, and blood pressure measurements were recorded in both the lab and the home with the same portable equipment. In the lab, however, skin conductance was measured with both the portable machine and a standard machine to test the reliability of the portable machine. No significant discrepancies were found between the measurements from the two machines and the skin conductance data from the portable machine was used in the analysis.
Data
The variables in the stored data are broken into three sets of data.
The first set of data consists of a task indicator variable and sixty-five measurements of each subject’s heart rate and skin conductance response under a number of different conditions. Examples of the variable names are included below to serve as a key for interpreting each variable.
Task = 1 if measurement was made while the subject performed the task, 0 otherwise
hSCR1P—Home (h) measurement of skin conductance response (SCR) for subject 1 (1) with their pet (P) present
hHR17F—Home (h) measurement of heart rate (HR) for subject 17 (17) with their friend (F) present
lHR31C—Lab (l) measurement of heart rate (HR) for subject 31 (31) with neither friend nor pet present (C—control).
Each variable in the second set of data represents six measurements of a subject’s blood pressure (either systolic or diastolic) and is named in a similar fashion to those above (see sample variable names below):
hSBP2P—Home (h) measurement of systolic blood pressure (SBP) for subject 2 (2) with their pet (P) present
lDBP6C—Lab (l) measurement of diastolic blood pressure (DBP) for subject 6 (6) with neither friend or pet present (C—control)
The six blood pressure measurements are ordered according to the following task conditions:
Pre-experiment
Rest #1
Task #1
Rest #2
Task #2
Rest #3
The third set of data provides the maximum and mean heart rates for each of the subjects under one of the three conditions (P, F, or C). The three variables are:
Condition—P, F, or C (pet, friend, or neither are present)
Max Heart Rate—maximum recorded heart rate for condition
Mean Heart Rate—mean heart rate for condition
Questions
Why did the experimenters test each subject twice, once alone in the lab and once at home under the pet, friend, or control condition?
Having each subject perform twice allows each subject to be her own control. Also, for those subjects who had neither their pets nor their friends present, the only difference between the sessions was the location and the slight change in task. Thus, the experimenters could see what effect, if any, these changes had. The laboratory session also gave the experimenters a chance to try out the portable equipment to measure skin conductance and compare the measurements to a standard machine to see if the portable machine was reliable.
a) Although only one-third of the participants actually performed the experiment with their pet dogs present, all subjects were dog owners who said they were close to their pets. Why didn't the experimenters include people who did not own pets in the friend present and control situations?
b) What effect does the process of selecting subjects in this experiment have on the population to which conclusions can be drawn?
a) The experimenters were trying to control for confounding factors. They didn't want any potential differences between a pet owner's and a non-pet owner's reactions to stress to confound the differences between having a dog present and having a friend present. Because the experimenters controlled as many external factors as possible, they increased the likelihood that any observed difference among groups is due to the factor of interest.
b) Selecting subjects as similar as possible limits the population to which conclusions are applicable. For example, this study gives no information on men's reactions to stress or whether cats evoke the same response as dogs. Furthermore, unless subjects were a random sample from a well-defined population, it is not clear to what larger population the results apply.
The device that measures skin conductance continuously records electrical impulses from the surface of the skin. The machine makes a continuous printout of the impulses which was analyzed at a later date by another experimenter to arrive at the measurements. For each 20-second period, the number of fluctuations exceeding a certain magnitude was counted and this number constituted the skin conductance measurement for that 20-second period. In this study, the experimenter who counted the impulses was blinded to whether a subject was in the pet, friend, or control condition. Suggest a reason why the experimenters took this precaution. When should blinding be implemented in an experiment?
Whenever a measurement requires any subjectivity, it is a good idea to implement blinding if possible. In this case there might be electrical pulses close to the threshold that require a judgment call as to whether they should be counted or not. If the experimenter does not know the condition the subject was under, he or she will not be influenced by any preconceived notions about what to expect under the different conditions.
Make three time series plots of the heart rates, using representative subjects from each of the three conditions. On each subject's plot include both the series for the home condition, and the series for the laboratory condition. How does the heart rate response from the laboratory compare with the response in the home? Describe completely what you see. Do you see any differences among the three conditions for your three subjects?
The time series plots for a subject from each of the three conditions are presented below:
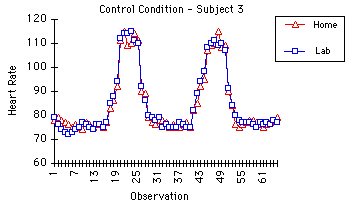
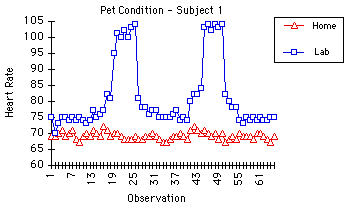
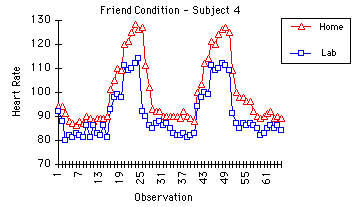
Since everyone's laboratory session was performed under identical conditions, it is not surprising that the laboratory heart rate patterns are similar for these three individuals. In each of these three cases, the subject's heart rate was stable during the rest periods and increased during each of the two tasks. We see a difference, however, among the patterns during the home session. With her pet present, subject one's heart rate did not increase during the counting backwards periods, it remained at the base level. Subject four, with her friend present, had a higher heart rate during the tasks than she did alone with the experimenter in the laboratory. Subject three, who was alone with the experimenter in both the laboratory and at home, had nearly identical heart rate patterns in both sessions.
To analyze this data further we will need to reduce each person's heart rate data to only one or two numbers. Suggest one or two reasonable summary statistics that we could use to reduce a subject's 65 heart rate measurements from a session to a single value.
Two reasonable summary statistics might be average heart rate and maximum heart rate. The average heart rate would combine information from the rest and task periods, while the maximum heart rate, which would most likely occur during one of the two task periods, would give information on the level of stress while performing the task. Other possible summary statistics might be the range of heart rates, average heart rate during the tasks only, or the difference in averages for task and non-task periods.
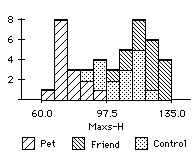
a) Create a histogram of maximum heart rate values. Describe the shape of the histogram.
b) Identify which regions of the histogram correspond to each of the three conditions. What do you see?
a) This histogram has a bimodal shape with peaks around 75 and 120.
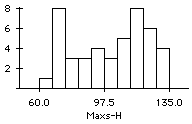
b) We see that the subjects with their pets had the lowest maximum heart rates, the subjects with their friends had the highest maximum heart rates, and the control subjects were somewhere in between.
Projects
Design and carry out an experiment to explore heart rate change under other conditions. Examples of other conditions could be cat present versus no cat present, or male friend versus female friend present.
References
Allen, K., Blascovich, J., Tomaka, J., and Kelsey, R. M. (1991)
Credits
This story was prepared by Kathleen Fritsch and last modified on 11/21/94. Thanks to Prof. Karen Allen of the Center for the Study of Biobehavioral and Social Aspects of Health at the State University of New York at Buffalo for providing the data.