Introduction
Red clover is a high quality legume![]() Legume:(leg yoom, li gyoom) Any plant of the family Leguminoase, especially those used for feed, food, or as a soil-improving crop. useful for pasture improvement, and is an important source of food for cattle. Even though red clover is a perennial plant, it often dies out quickly because of a number of factors including climate conditions, methods of management, and root-feeding insects. Larvae of insects such as the imported longhorned weevil, Calomycterus setarius (an insect dependent on crawling for dispersal because the adults lack wings) can damage red clover by feeding on its roots. Studies were conducted by Culik and Weaver (1994) at a site in Monongalia County, WV, in order to try to understand the migratory patterns of various root-feeding insects, one of which was the imported longhorned weevil.
Legume:(leg yoom, li gyoom) Any plant of the family Leguminoase, especially those used for feed, food, or as a soil-improving crop. useful for pasture improvement, and is an important source of food for cattle. Even though red clover is a perennial plant, it often dies out quickly because of a number of factors including climate conditions, methods of management, and root-feeding insects. Larvae of insects such as the imported longhorned weevil, Calomycterus setarius (an insect dependent on crawling for dispersal because the adults lack wings) can damage red clover by feeding on its roots. Studies were conducted by Culik and Weaver (1994) at a site in Monongalia County, WV, in order to try to understand the migratory patterns of various root-feeding insects, one of which was the imported longhorned weevil.
Synopsis
Abstract
A study is presented which examines the seasonal migration of weevils between pastures, red clover fields, and woods. The proportion of the population migrating between two environments was estimated by counting weevils found in strategically located traps.
Data Set
6 variables and 2 cases
Extensions
2 data tables and map.
2 Questions
Interpretation of data, estimated proportions, populations, confidence intervals, hypothesis testing.
Basic: Q1-2
Protocol
The experimenters placed "pitfall traps" between red clover fields and the adjacent pasture and woods. These traps were used to monitor seasonal variation and direction of crawl for root-feeding insects. Trapping took place from May to November 1990, March to December 1991, and April to June 1992.
Below is a diagram of the study site indicating locations of the pitfall traps with respect to clover stands, the adjacent pasture, and woods (not to scale). Traps were located at the vertices of the barriers.
Traps
A = RC-Woods
B = Woods-RC
C = RC-Pasture
D = Pasture-RC
Results
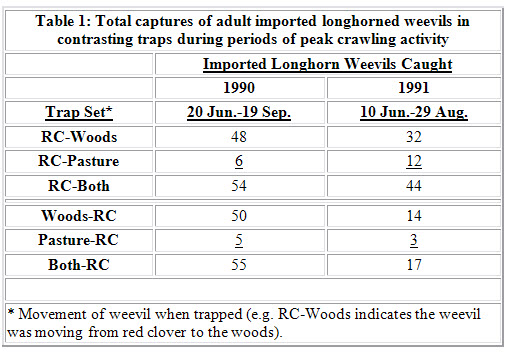
Tables 1 and 2 below give the counts of trapped weevils. We use the following notation to indicate the movement of the weevils:
RC-Woods = from the red clover to the woods,
Woods-RC = from the woods to the red clover,
RC-Pasture = from the red clover to the pasture,
Pasture-RC = from the pasture to the red clover,
RC-Both = from the red clover to either the woods or pasture, and
Both-RC = from either the woods or pasture to the red clover.
Data
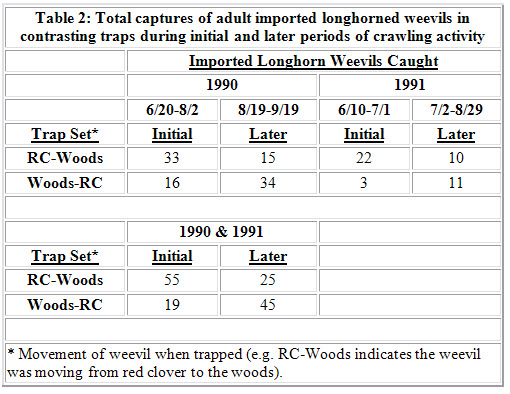
The stored data contains the columns of data given in Table 2.
C1 = Counts of weevils moving from red clover to woods and woods to red clover for the 1990 initial period.
C2 = Counts of weevils moving from red clover to woods and woods to red clover for the 1991 initial period.
C3 = Counts of weevils moving from red clover to woods and woods to red clover for the 1990 later period.
C4 = Counts of weevils moving from red clover to woods and woods to red clover for the 1991 later period.
C5 = Cumulative counts of weevils moving from red clover to woods and woods to red clover for the 1990 and 1991 initial periods.
C6 = Cumulative counts of weevils moving from red clover to woods and woods to red clover for the 1990 and 1991 later periods.
Questions
a) To understand migratory patterns of the imported longhorned weevil, look at the data in Table 1. Were the imported longhorned weevils more likely to be moving between the red clover and the woods or between the red clover and the pasture?
b) Offer some possible explanations for your findings in Part a.
c) Using the data from Table 1, what would be your estimate of the proportion of the population of crawling imported longhorn weevils that are in transit between the woods and the red clover (as opposed to those in transit between the pasture and the red clover)?
d) Calculate an approximate 95 percent confidence interval for the proportion of crawling weevils in transit between the woods and red clover based on the data in Table 1. Comment on the results.
e) Specify the population we are making inference about in Part d.
a) From Table 1 we see that there were a total of 109 imported longhorned weevils trapped in 1990, 98 of which (89.9 percent) were either RC-Woods or Woods-RC. In 1991 a total of 61 imported longhorned weevils were trapped, 46 of which (75.4 percent) were either RC-Woods or Woods-RC. Since most of the trappings involved weevils either coming from or going to the woods (as opposed to the pasture) it certainly seems that the weevils are more likely to be moving between the red clover and the woods than between the red clover and the pasture.
b) One possible explanation is that imported longhorned weevil adults live in the woods and come out of the woods to eat red clover and/or breed. Another possible explanation is that the weevils living in the pasture have plenty of food there and don't need to crawl to the red clover to eat.
c) An estimate for p would be
From Table 1 we have
d) An approximate 95 percent confidence interval for p is
where z.025 is the upper 2.5 percent standard normal critical value. Thus the 95 percent confidence interval for p is (0.7985, 0.9055). The confidence interval is far from containing 0.5, so it indicates that there are more weevils in transit between the woods and red clover than between the pasture and red clover.
e) We are making inference about a very specific population of imported longhorned weevils—those that crawl in the studied area during periods of peak activity. Recall that only crawling insects are trapped and that the experimental results were limited to certain peak periods of crawling activity.
a) The researchers suggest that during initial periods of imported longhorned weevil activity, a greater number of imported longhorned weevils moved from the red clover towards the woods rather than from the woods to red clover, and later, the number of imported longhorned weevils moving from the woods towards the clover was greater than the number moving from the red clover towards the woods. Use the combined data in Table 2 for 1990 and 1991 to test their claim.
b) The dates for the initial and later periods differed in 1990 and 1991. This occurred because of weather differences in the two years, and suggests conducting tests of association between type of trap and time period (initial or later) trapped for each year separately. Conduct tests of association for both 1990 and 1991. Do your results support the same hypothesis as in Part a?
c) Should we conclude that the migratory pattern suggested by Culik and Weaver (1994) is indeed the case for the imported longhorned weevil?
a) We perform a chi-square test of independence using the data from Table 2. The null and alternative hypotheses are:
H0: There is no association between type of trap and time period (initial or later).
Ha: There is an association between type of trap and time period.
The data in Table 2 give a value of χ2 = 21.7, which when compared to a chi-square distribution with 1 df has a P-value < 0.0001. This indicates that we have very strong evidence against the null hypothesis. We conclude that there is strong evidence of an association between the type of trap that an imported longhorned weevil was caught in and the time period in which it was caught.
b) The null and alternative hypotheses are the same as in Part a, namely
H0: There is no association between type of trap and time period.
Ha: There is an association between type of trap and time period.
For the 1990 data we find that χ2 = 13.2 with 1 df, P-value = 0.0003.
For the 1991 data we find that χ2 = 8.8 with 1 df, P-value = 0.003.
In each case there is strong evidence in favor of rejecting the null hypothesis. The results support the same conclusion as in Part a. That is, there is an association between type of trap and time period. The data suggests that this association is in the direction the researchers proposed. Namely, that during initial periods of activity, greater numbers of imported longhorned weevils move from the red clover to the woods than from the woods to red clover, and later, greater numbers of imported longhorned weevils move from the woods to the red clover.
c) Two years showing the same pattern is certainly suggestive of the migratory pattern being as the researchers suggest. One should, however, always consider other possible confounding factors that might explain the weevils' movement.
References
Culik, M., and Weaver, J. (1994)
Credits
This story was prepared by Mark Zabel and last modified on 4/4/95. Thanks to Dr. Mark P. Culik of the Division of Plant and Soil Sciences at West Virginia for supplying the data and photographs.