Introduction
Are radar detectors used by drivers as helpful reminders to obey the speed limit? Or are they used by excessive speeders interested only in eluding police detection? To decide between these possibilities, researchers Teed, Adrian, and Knoblauch examined how soon cars returned to their original speeds after slowing down in response to police radar. These investigators conducted
two studies: one to determine how the entire traffic stream reacts to hidden police radar; and the second to compare speeding vehicles with and without radar detectors. Both studies were conducted on the interstate highway west of Hagerstown, Maryland.
Synopsis
Abstract
Two studies are presented which examine the effects of radar detectors on traffic speed. One study measures the effect of the presence or absence of police radar on the speed of the traffic stream at fixed distances from hidden police radar. The second study measured the speeds of cars exceeding the speed limit at fixed intervals after being “hit” with police radar. Whether or not these cars had radar detectors was inferred by behavior after being exposed to radar.
Extensions
Two data tables.
5 Questions
Observational studies, confounding factors, graphical analysis, confidence intervals, validity of inferential statements, consequences of excluding data.
Basic: Q1 – Q5
Protocol:
First Study
In the first study the speed and length of eastbound vehicles were measured using electronic devices embedded in the pavement at a fixed location. These measurements were made under five conditions: without any radar exposure, and with police radar set up either 5 miles before, 2 miles before, 1 mile before, or right at the location of the speed measurements. The no-radar condition was alternated at one hour intervals with one of the four radar conditions. This study was conducted Monday through Thursday between 9 a.m. and 5 p.m. over a three-week period of time.
Second Study
In the second study the speeds of westbound vehicles were measured at 5 locations along a 4 mile stretch of the highway using a radar system that is not detectable by commercial radar detector units. Vehicles going faster than 65 mph at the first location became part of the study. Conventional police radar was then directed at the vehicle and if its brake lights appeared, or its speed decreased by at least 5 mph in the next few seconds, the vehicle was classified as having a radar detector. The speeds of all vehicles were measured at the remaining locations and checked for association with the presumed presence of radar detectors. All data were collected over a one-week period between 9 a.m. and 5 p.m. Monday through Thursday.
Results
See the below tables:
Table 1: First Study Results
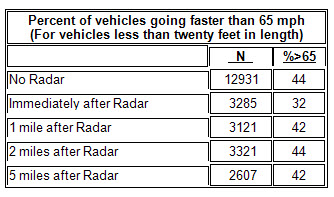
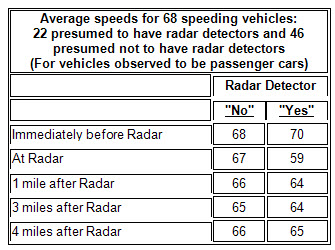
Table 2: Second Study Results
Questions
In describing their methods Teed, Adrian, and Knoblauch state that:
“Data for both studies were gathered during clear weather on a mostly level stretch of rural Interstate 70 west of Hagerstown, Maryland. Speed limits were 55 mph for all vehicles. Citizens band (CB) radio was monitored to determine the degree to which drivers with radar detectors alerted other drivers to the presence of radar signals and to assure that the study area was free of police enforcement or construction activities that might affect vehicle speeds.”
What is the purpose of the methodology described in this paragraph?
The researchers could not control which cars came into their sample so this was an observational study making it important to control for obvious confounding factors. In this case the investigators wanted to argue that when the cars slowed down it was in response to the hidden radar and not to alternative explanations like the weather, curves in the road, city traffic, a changing speed limit, warnings from other motorists, seeing a patrolling police car, or highway construction.
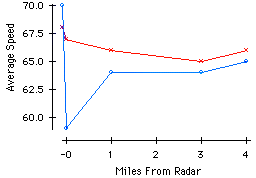
Using the data from the second study, make a plot which compares how the average speed depends on a vehicle's distance from radar for cars presumed to be with and without detectors.
Table 2: Second Study Results
The data from the table is plotted below (cars presumed to have radar detectors are indicated by blue o's; cars presumed to not have detectors are indicated by red x's):
Using the data from the first study make a 90% confidence interval for the percentage of cars that reduce their speed from greater than 65 mph to less than 65 mph when exposed to police radar. Describe any assumptions that you need to make for your interval to be valid and comment on their appropriateness.
Table 1: First Study Results
Data from 14 of the 70 possible hours of observation in the first study were not used because of bad weather, unscheduled police patrols, and construction activities. Comment on what effect this may have on interpreting the conclusions of the study and suggest ways that this effect may have been avoided.
In describing the results from the second study, the researchers state that "Those vehicles with radar detectors were significantly faster than those without them before radar exposure (p < 0.01) ... and significantly slower immediately after (p < 0.0001) ..." Discuss the validity of these inferential statements.
It was not really known which cars had radar detectors and which did not. Cars were presumed to have radar detectors when their speeds were reduced by at least 5 mph in the presence of radar exposure. Thus, it is not fair to test the foregone conclusion that the cars classified as having radar detectors would have a slower average speed immediately after radar exposure.
References
Teed, N., Adrian, K.L., and Knoblauch, R. (1991)
Credits
The story was prepared by Dennis Pearl and last modified on 6/22/93. Maryland map was prepared by Greg Elfring.