Introduction
During the past two decades several epidemiological![]() Epidemiological:A branch of medical science that deals with the incidence, distribution, and control of disease in a population. studies were conducted to explore the association between Environmental Tobacco Smoke (ETS) and lung cancer. Most of these studies concluded that ETS is a strong causative agent of lung cancer. Bar and tavern workers, in particular, are exposed to unusually high levels of tobacco smoke every day. The state of California, therefore, passed a bill prohibiting smoking in bars and taverns. The law took effect on January 1, 1998. To study the effect of ETS on bartenders, researchers at the Cardiovascular Research Institute at the University of California, San Francisco (see Eisner, Smith, and Blanc, 1998) studied bartenders from a sample of 25 bars and taverns in San Francisco before and after the law took effect.
Epidemiological:A branch of medical science that deals with the incidence, distribution, and control of disease in a population. studies were conducted to explore the association between Environmental Tobacco Smoke (ETS) and lung cancer. Most of these studies concluded that ETS is a strong causative agent of lung cancer. Bar and tavern workers, in particular, are exposed to unusually high levels of tobacco smoke every day. The state of California, therefore, passed a bill prohibiting smoking in bars and taverns. The law took effect on January 1, 1998. To study the effect of ETS on bartenders, researchers at the Cardiovascular Research Institute at the University of California, San Francisco (see Eisner, Smith, and Blanc, 1998) studied bartenders from a sample of 25 bars and taverns in San Francisco before and after the law took effect.
Synopsis
Abstract
Using interview data and direct measurements of lung function, researchers try to find if there is an association between smoking by patrons in bars and the respiratory health of bartenders in San Francisco, CA.
Extensions
Tables of results, project idea.
2 Questions
Experimental design, graphical data analysis, confounding factors, and confidence intervals.
Basic: Q1-2
Protocol
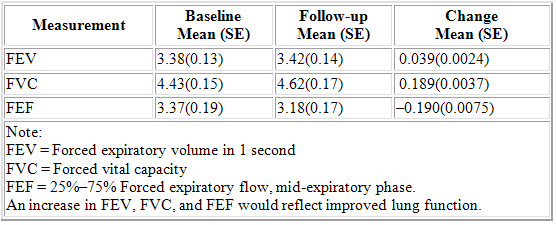
A random sample of 83 bars and taverns was selected in San Francisco, CA. Of the sampled bars and taverns, 25 agreed to participate in the study. Those 25 bars and taverns employed 124 bartenders with 67 of them working at least one daytime shift per week. These 67 bartenders were the intended subjects in the study. All subjects underwent a standard baseline interview, conducted by a single study investigator, in their workplaces. Questions used in this interview were based on a questionnaire from the International Union Against Tuberculosis and Lung Disease. The follow-up interviews, conducted 8 weeks after the law went into effect, also consisted of the same questions about respiratory symptoms and sensory irritation symptoms. At both interviews subjects were asked to perform three expiratory![]() Expiratory:Of, relating to, or employed in exhaling of air from the lungs. maneuvers and their lung function was measured with a portable spirometer. The three lung measurements taken were Forced Expiratory Volume
Expiratory:Of, relating to, or employed in exhaling of air from the lungs. maneuvers and their lung function was measured with a portable spirometer. The three lung measurements taken were Forced Expiratory Volume![]() Forced Expiratory Volume:Amount of air exhaled forcefully from lungs in a given period of time. in one second (FEV), Forced Vital Capacity
Forced Expiratory Volume:Amount of air exhaled forcefully from lungs in a given period of time. in one second (FEV), Forced Vital Capacity![]() Forced Vital Capacity:The volume of gas that can be expelled with force from lungs filled to capacity, with no limit to the duration of expiration. (FVC) and Forced Expiratory Flow
Forced Vital Capacity:The volume of gas that can be expelled with force from lungs filled to capacity, with no limit to the duration of expiration. (FVC) and Forced Expiratory Flow![]() Forced Expiratory Flow:Rate of airflow exhaled forcefully from lungs., midexpiratory phase (FEF). The mean interval between baseline and follow-up interviews was 56 days. Fifty-four of the 67 daytime bartenders completed the baseline interview (81%). Of these, 53 (98%) also completed the follow-up.
Forced Expiratory Flow:Rate of airflow exhaled forcefully from lungs., midexpiratory phase (FEF). The mean interval between baseline and follow-up interviews was 56 days. Fifty-four of the 67 daytime bartenders completed the baseline interview (81%). Of these, 53 (98%) also completed the follow-up.
Results
The following are based on tables and the accompanying notes that were included in the Eisner, Smith, and Blanc (1998) paper.
Table 1: Location of Participating and Nonparticipating Bars and Taverns in San Francisco
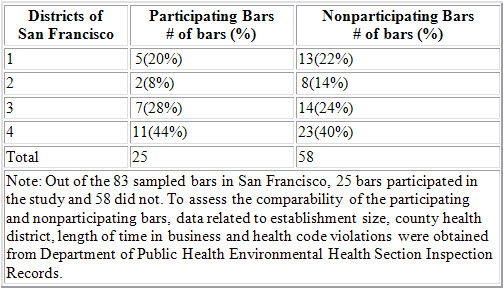
Table 2: Personal smoking and ETS exposure at baseline and follow-up interviews (n = 53 bartenders)
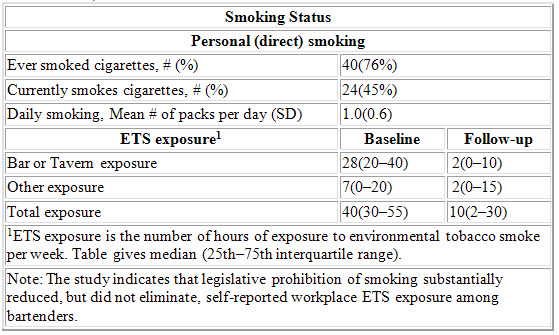
Table 3: Respiratory and sensory irritation symptoms in bartenders before and after prohibition of smoking in bars (n = 53 bartenders).
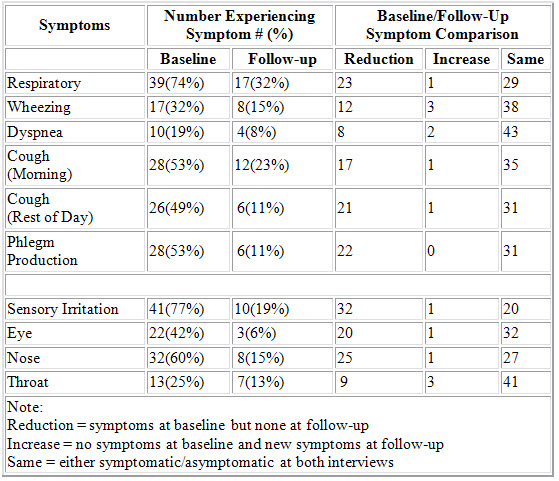
Table 4: Pulmonary function in bartenders before and after prohibition of smoking in bars (n = bartenders).
Questions
a) Is this a well-designed study? Comment. How well was the study design implemented? Explain.
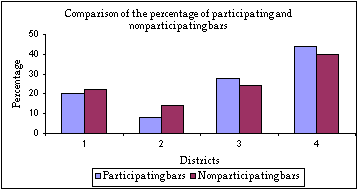
b) Examine the percentages of participating and nonparticipating bars located in each of the four districts of San Francisco using the data from Table 1. Do the differences suggest that there might be systematic biases present in the responding bars or could the differences be explained by chance?
Table 1: Location of Participating and Nonparticipating Bars and Taverns in San Francisco
a) From the protocol we know that this study is based on a random sample of bars in San Francisco. Random selection helps eliminate sources of bias from an observational study and hence is a good feature of the study. Note, however, that 83 bars were sampled but only 25 of them agreed to participate in the study. Thus, there could be a problem with nonresponse bias.
b)
The percentages of participating and nonparticipating bars located in the four districts are fairly similar. The largest difference in percentages occurs in District 2 (8% of participating bars and 14% of the nonparticipating bars fall in that district). A 95% confidence interval for the difference in the percentages between participating and nonparticipating bars for District 2 is given by (–0.198, 0.082) which contains zero. Thus we conclude that there is no significant difference in the percentages of the participating and nonparticipating bars for District 2. Since all the other districts have smaller differences in percentages of participating and nonparticipating bars, we would not find statistically significant differences in those districts either. Alternately, a chi-square test of difference in the geographical distribution gives a P-value of 0.526, indicating that there is no significant difference in participation rates by district.
a) Which of the variables listed below might be potential confounding factors in this study? Why?
1. Age of the subject
2. Personal smoking
3. Gender of the subject
4. Development of a cold or other respiratory tract infection just before or during the duration of the study
5. Educational attainment of the subject
b) What adjustments would you make in your analysis, if you had the necessary data, to account for these confounding factors so that the results would be less biased?
c) Are there any potential biases in the data reported by the bartenders in Table 3? Explain.
Table 3: Respiratory and sensory irritation symptoms in bartenders before and after prohibition of smoking in bars (n = 53 bartenders).
a) Both personal smoking and development of a cold or other respiratory tract infection before or during the duration of the study can be potential confounding factors in this study because both might impair lung functioning independently of exposure to secondhand smoke. In addition, some bartenders may have quit smoking (or reduced their smoking) because of the change in the law.
b) To address the potential confounding effects of personal smoking and development of respiratory tract infection, the data can either be stratified according to these two factors or one can include variables to control for these factors in a model while doing the analysis.
c) The bartenders probably know that secondhand smoke is not good for their health. So they may be biased in the direction of reporting fewer symptoms after the ban.
Projects
Read the article “Multicenter Case-Control Study of Exposure to Environmental Tobacco Smoke and Lung Cancer in Europe” by Boffetto et al. (1998) in the Journal of the National Cancer Institute, Volume 90, No. 19, pages 1440–1449. Explore the data presented and compare your conclusions with those stated in the abstract on the first page of this paper. Also compare and contrast your results with those of the bartenders’ data.
References
Eisner, M. D., Smith, A. K., and Blanc, P. D. (1998).
Credits
Initiated by Sumithra Mandrekar.
Completed by Sumithra Mandrekar.
Thanks to Dr. Mark D. Eisner, University of California, San Francisco, for clarifications on the FEF pulmonary measurement.