
Introduction
With the availability of telecommunication today and the use of computer assisted random-digit-dialing, almost all public opinion and political polls are telephone surveys.
Phone surveys are generally more expensive than mail surveys but often provide a higher response rate. On the other hand, phone surveys are less expensive and less time consuming than personal interview surveys but they generally have a larger non-response bias. One problem found in all three survey methods is the subject's refusal to participate in the survey process. For mail surveys and personal home interviews, many researchers have found that sending an advance letter indicating the survey's goals and sponsorship increases the overall response rates. While an advance letter may not be practical in many random-dialed telephone surveys, an analogous opportunity may present itself if the phone is answered by an answering machine. Researchers Xu, Bates, and Schweitzer (1993), investigated the usefulness of leaving three different types of messages on the telephone answering machine. They hoped to find a significant difference in the eventual response and refusal rates for those cases when they left a message as opposed to those cases when they did not leave a message.
Synopsis
Abstract
A study is presented which investigated the usefulness of leaving different types of messages on answering machines when doing random-digit-dialing telephone surveys.
Extensions
Table of results.
4 Questions
Objectives, bias, response rates, significance testing, pooled two-sample t tests, confounding factors, experimental design.
Basic: Q1-4
Protocol
Xu, Bates, and Schweitzer (1993) constructed three types of messages to be left on answering machines for their study. The complete message is given below and includes an indication of university sponsorship and an appeal as to the importance of making contact to complete the survey. A second variation of the message eliminated the appeal, while the third variation also eliminated the information including university sponsorship.
This is (interviewer name), calling from the Institute for Communications Research {at Texas Tech University}. We are conducting a survey in the Lubbock area to ask your opinions about current political issues. [We expect some of the issues to be considered in the future by the state legislature. It's very important that we speak to you.] Your phone number was randomly selected and your answers will be kept confidential. We'll call back in the next day or two. Thank you.
{indicates university sponsorship}
[appeal as to the importance of the survey]
These three types of messages were chosen because earlier studies involving mail and personal contact surveys have shown higher response rates when university sponsorship and appeals are included in the advance letter.
Three random-digit-dialing surveys of the general public were conducted in the Lubbock, Texas, area during October and November 1990. Each of the surveys dealt with public opinion, media use, and the gubernatorial election. All of the calls were placed from a central location to permit supervision of the university student interviewers by the researchers. Each number was called three times, if necessary, before it was classified as a non-responding household. When contact was made, the interviewer asked to speak to the adult who had had the most recent birthday. If an answering machine took the initial call, one of the four messages (the three versions above and "no message") was randomly selected and left by the interviewer on the machine. The first call was used to label the initial status of the household as "Successful" if a resident answered the phone and "Unsuccessful" if the call went unanswered, the line was busy, or an answering machine took the call. If the initial call was labeled "Unsuccessful," three types of respondent participation were defined as follows:
Eventual Contact—a household where the interviewer spoke to an adult.
Completed Survey—a household where an interview was completed.
Refused—a household where an adult refused to complete an interview.
Results
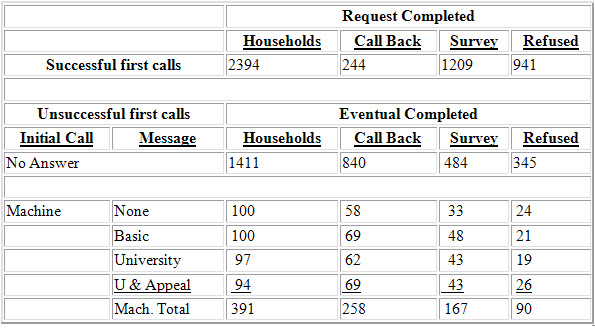
2394 of the 4196 initial call attempts were successful. Of these successful calls, 1209 completed the survey, 941 refused, and 244 requested a call back. Among the 1802 unsuccessful calls, 391 were answered by a machine while 1411 were either busy or went unanswered. The final results for the unsuccessful calls are given in the following table. The table includes message type for the cases where a machine answered the call.
Questions
In your own words, summarize the authors' objectives for the study and provide an explanation of how the data in the table can address these objectives.
Xu, Bates, and Schweitzer (1993) believe that the answering machine can function in phone surveys in an analogous manner to that of the advance letter in mail surveys and thereby increase the contact rate and response rate for the survey. By some simple calculations using the data in the table we can see the proportion of contacts and responses are higher for those households in which a message was left on an answering machine than in the households in which no message was left.
What do you see as potential sources of bias in telephone surveys (as opposed to personal or mailed surveys) and what steps can be taken to eliminate some of the bias?
The main sources of bias are that a certain percentage of the population does not own a phone and also that many subjects in the target population are not at home at the time of the call. Both groups may differ systematically from the target population, thus their exclusion from the survey may produce bias. While a well-designed telephone survey is not able to correct for the first source of bias, the use of multiple call back plans could help avoid the latter source of bias, particularly if the call back plans occur at a variety of times of the day or night.
Xu, Bates, and Schweitzer (1993) define the eventual contact rate as
# of Eventual Contacts
# of Households
and report that the "eventual contact rate was significantly higher (t = 2.32, P = 0.020) for the answering machine households (66.0%) than for the no answer households (59.5%)."
To achieve this result the researchers used the data in the table to perform a pooled two-sample t test of the hypotheses:
H0: µ(Machine) – µ(No Answer) = 0
vs.
Ha: µ(Machine) – µ(No Answer) ≠ 0.
a) Does the significance test conducted by the researchers support their conclusion? Why or why not?
b) Comment on the researchers’ use of the t test. Is this the test you would use? Explain.
c) Use the data in the table to construct a test of a hypothesis involving leaving a message and the contact rates in telephone surveys keeping in mind your answers to Parts a and b. Be sure to state your hypotheses clearly and state any assumptions you are making to construct your test.
a) The researchers' conclusion is overstated. We cannot say that all of the no answer calls were to households that did not own an answering machine since some of the initial calls were busy or the machines may have been turned off. Their conclusion also does not address whether or not leaving a message increases the contact rate since they include the no message calls with the message calls for their test.
b) The t test is generally used on interval data that approximates a normal distribution. The data in this study is count data and the parameters of interest are population proportions. For count data one could use a z test if comparing two population proportions or a chi-square test for two or more population proportions.
c) We will limit our test to those households where a machine answered the initial call, assume all the calls were made independently of each other, and use a z test to compare the two contact rates px and py of the Message and No Message populations respectively. Since the researchers believe that leaving a message on the answering machine will increase the contact rate we will use the one-sided test of
H0: px = py vs. Ha: px > py.
The test statistic is
z = ![]() where sp =
where sp = ![]() and
and ![]()
From the data in the table we find z = 1.95 and the associated P-value is 0.0256. We would therefore reject the null hypothesis that the contact rates are the same whether or not a message is left on an answering machine.
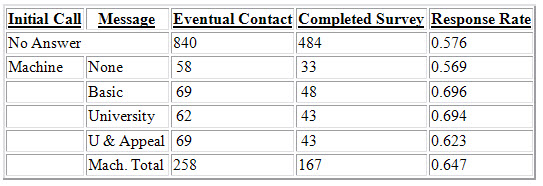
Xu, Bates, and Schweitzer (1993) define the response rate as
# of Completed Surveys
# of Eventual Contactsa) Use the data in the table to compute all of the response rates.
b) The researchers report that "Answering machine households were also most likely to complete an interview (t = 3.00, p = 0.003)" (as opposed to no answer households). What confounding factors may be present in the researchers' test and what additional information about the follow-up calls would give you a better idea as to the presence of these confounding factors?
c) How would you design the experiment to eliminate the confounding factors you gave in Part b?
a)
b) It is unclear from the information given whether or not every household that represented an eventual contact was given the full information about the study which includes the university sponsorship and appeal portions of the message. If some of the households were never completely informed this might be confounded with the response rates of the no answer and machine answered households. We need more information on what was said during the interview when contact was made.
c) The researchers should control for the information that is given during eventual contact to eliminate this confounding factor. This could be accomplished by giving the total information during eventual contact or randomly assigning message types to the no answer households who are eventually reached.
References
Xu, M., Bates, B. J., and Schweitzer, J. C. (1993)
Credits
This story was prepared by Greg Elfring and last modified on 3/16/94.