Introduction
Air pollution laws regulating industrial emissions are generally based on a requirement to avoid emission levels which are higher than an initially measured baseline. This often creates an unusual disagreement in which a company may argue that they are currently emitting more pollutants than the government recognizes in the hope of establishing a higher baseline against which future emissions will be compared.
Synopsis
Abstract
The baseline level of pollutants from an oil refinery was determined by daily measurements made over a one-month period. These values are compared with nine measurements taken over a three-year period to assess whether the refinery had increased emissions of pollutants during the period of time when the baseline level was determined.
Data Set
3 variables, 40 cases
Extensions
2 data tables.
2 Questions
Randomness of samples, descriptive statistics, graphical analysis, two-sample t-test.
Basic: Q1-2
Protocol
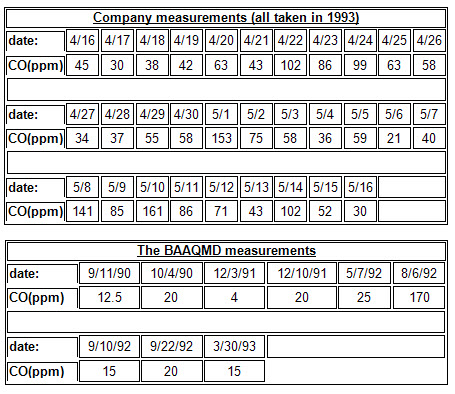
An oil refinery northeast of San Francisco conducted a series of 31 daily measurements of the carbon monoxide![]() Carbon monoxide:An odorless toxic gas produced by the incomplete burning of carbon. levels in emissions from one of their stacks between April 16 and May 16, 1993. The measurements were submitted as evidence for establishing a baseline to the Bay Area Air Quality Management District (BAAQMD) which is the governmental agency charged with monitoring the air quality of the counties in the San Francisco Bay Area. BAAQMD personnel had also made 9 independent measurements of the carbon monoxide from this same stack over the period from September 11, 1990 to March 30, 1993. The carbon monoxide being measured results from burning during the "cracking" process in which hydrocarbon
Carbon monoxide:An odorless toxic gas produced by the incomplete burning of carbon. levels in emissions from one of their stacks between April 16 and May 16, 1993. The measurements were submitted as evidence for establishing a baseline to the Bay Area Air Quality Management District (BAAQMD) which is the governmental agency charged with monitoring the air quality of the counties in the San Francisco Bay Area. BAAQMD personnel had also made 9 independent measurements of the carbon monoxide from this same stack over the period from September 11, 1990 to March 30, 1993. The carbon monoxide being measured results from burning during the "cracking" process in which hydrocarbon![]() Hydrocarbon:A group of organic compounds found in petroleum, natural gas, and coal. chains are broken down into shorter pieces.
Hydrocarbon:A group of organic compounds found in petroleum, natural gas, and coal. chains are broken down into shorter pieces.
Results
The below tables present the two sets of raw carbon monoxide (CO) measurements in parts per million (ppm).
Data
The following variables are contained in the stored data:
CO = the carbon monoxide measurements (in parts per million)
Source = the source of the measurement (refinery or BAAQMD)
Date = the date that the measurement was taken
Questions
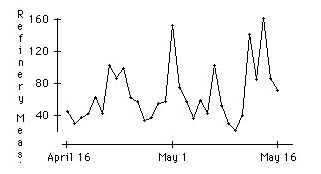
Examine the carbon monoxide values reported by the refinery. Do they look like a random sample of 31 independent observations?
The refinery measurements were taken on 31 consecutive days. Unlike what would be expected for a random sample, the data show clear cycles with time (the rank correlation between consecutive values is 0.42):
We wish to determine if the carbon monoxide values reported by the refinery are generally higher than those measured by the BAAQMD.
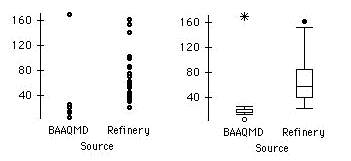
a) Give descriptive statistics and make a graph which addresses this issue.
b) Alternatively, could the two samples be from the same distribution and the observed differences just be the result of chance error? To decide, a two-sample t-test is carried out as follows:
mean of the refinery sample = 66.6 with a standard deviation of 35.9,
mean of the BAAQMD sample = 33.5 with a standard deviation of 51.5,
difference in means = 33.1, estimated standard error of difference = 18.5,
t-statistic = 1.8 (with 10 degrees of freedom) p-value ≈ 0.1.
Does chance variation look like a reasonable explanation of the data or is there something wrong with the test?
a) The mean and median of the refinery sample are both higher than the corresponding values for the BAAQMD sample (means: 66.6 compared with 33.5, medians: 58 compared with 20). Comparative dotplots and boxplots of the two samples illustrate the difference between them.
b) There is something wrong with the test. The refinery values should not be assumed to be independent (see Question 1). Also, it is not likely that either the refinery or the BAAQMD measurements came from a normal distribution. For example, there is a single large outlier among the BAAQMD measurements which is nearly seven times larger than the second largest value. Interestingly, a two-sample t-test with this outlier removed or a Mann-Whitney-Wilcoxon rank sum test on all the data both give very small p-values. However, a small p-value does not tell us why the samples are different (e.g. a changing rate of emissions with time versus bias in one of the measuring processes).
Technical comment: Adjusting the analysis by taking the log transform of both samples and assuming an autoregressive model for the transformed refinery data also indicates a significant difference between the refinery and BAAQMD samples.
Credits
This story was submitted on 11/15/93 by David Fairley; revised on 12/10/93 by Dennis K. Pearl.