


Introduction
Could someone tell how intelligent you are just by looking at your head? Are the size and weight of your brain
indicators of your mental capacity? The debate over the relationship between intelligence and brain size has
been waged throughout most of written history. Early investigations in this area of research were crude as
researchers simply measured the size of the subject's head. Later studies included measurements of the size
and weight of the brain taken after a subject had died. Many of the results of these early studies into the
connection between brain size and intelligence have since been dismissed because of the crude manner in
which the measurements were taken and/or experimental bias on the part of the researchers. This has not,
however, ended the debate over a connection between brain size and intelligence, and the continuing
advancements in science and technology have led to many other ways to measure the "size" of the brain. In
this study by Willerman et al. (1991) the researchers use Magnetic Resonance Imaging (MRI)![]() Magnetic Resonance Imaging (MRI):Used to make images of tissues with a high fat or water content by recording the reflections of the magnetic waves. to determine the
brain size of the subjects while taking into account gender and body size to draw conclusions about the connection between brain size and intelligence.
Magnetic Resonance Imaging (MRI):Used to make images of tissues with a high fat or water content by recording the reflections of the magnetic waves. to determine the
brain size of the subjects while taking into account gender and body size to draw conclusions about the connection between brain size and intelligence.
Synopsis
Abstract
In this story, researchers try to find an association between brain size and intelligence. Brain size is
measured using magnetic resonance images (MRI's) and intelligence is measured using SAT scores and
Wechsler IQ tests subscores.
Data Set
7 variables, 40 cases
Extensions
Description of selected sample, project
6 Questions
Validity and reliability of measurement scales, graphical analysis, relationships, correlation, Simpson's
paradox, regression, R2, interpreting conclusions.
Basic: Q1-5
Semi-Tech: Q6
Protocol
Willerman et al. (1991) conducted their study at a large southwestern university. Using SAT and IQ test scores
as a guide, the researchers selected 40 subjects from a pool of study volunteers (see description of the
sample selection) to undergo the MRI scans of their brains. The MRI Scans were performed at the same
facility for all 40 subjects. The scans consisted of 18 horizontal MRI images that were 5 mm thick, 2.5 mm
apart with the initial image beginning at the west margin of the cerebellum (see picture). The images
contained 256 levels of gray on a 256 x 256 pixel![]() Pixel:A small dot that makes up the image on a computer screen. area. Using a Vax computer, and without knowledge of the
sex or IQ of the subject, the researchers traced the boundary of the scalp by setting to zero any pixel which
had a gray scale intensity below 96. This procedure eliminated most of the brain coverings with any of the
remaining coverings requiring manual removal with a cursor. The computer counted all pixels with non-zero
gray scale in each of the 18 images and the total count served as an index for brain size.
Pixel:A small dot that makes up the image on a computer screen. area. Using a Vax computer, and without knowledge of the
sex or IQ of the subject, the researchers traced the boundary of the scalp by setting to zero any pixel which
had a gray scale intensity below 96. This procedure eliminated most of the brain coverings with any of the
remaining coverings requiring manual removal with a cursor. The computer counted all pixels with non-zero
gray scale in each of the 18 images and the total count served as an index for brain size.
Sample selection
The final sample consisted of 40 right-handed Anglo introductory psychology students who had indicated no history of alcoholism, unconsciousness, brain damage, epilepsy, or heart disease. These subjects were drawn from a larger pool of introductory psychology students with total Scholastic Aptitude Test Scores of ≥ 1350 or ≤ 940 who had agreed to satisfy a course requirement by allowing the administration of four subtests (Vocabulary, Similarities, Block Design, and Picture Completion) of the Wechsler (1981) Adult Intelligence Scale-Revised. With prior approval of the University's research review board, students selected for MRI were required to obtain prorated full-scale IQs of ≥ 130 or ≤ 103, and were equally divided by sex and IQ classification. Willerman et al. (1991)
Results
For the 20 men in the study, the researchers report correlations between IQ scores and brain sizes before
and after controlling for body size of r = 0.51 (p-value < 0.05) and r = 0.65 (p-value < 0.01) respectively. For
the 20 women in the study, the researchers report the corresponding correlations to be r = 0.33 (p-value not
significant) and r = 0.35 (p-value not significant). With both genders pooled the correlation between IQ and
adjusted brain size was r = 0.51 (p-value < 0.05).
Data
The following variables are contained in the stored data. The weights of two subjects and the height of one subject were withheld by the researchers for reasons of confidentiality.
Gender = Male or Female
FSIQ = Full Scale IQ scores based on the four Wechsler (1981) subtests
VIQ = Verbal IQ scores based on the four Wechsler (1981) subtests
PIQ = Performance IQ scores based on the four Wechsler (1981) subtests
Weight = body weight in pounds
Height = height in inches
MRI Count = total pixel count from the 18 MRI scans
Questions
In this study, Willerman et al. (1991) have used the combined information provided by gender, height and weight as a measure of body size, MRI scans as a measure of brain size, and FSIQ scores as a measure of intelligence. Discuss the validity and reliability of each of these instruments as a measure of the desired characteristic.
Taken together gender, height, and weight can provide both valid and reliable information about body size. Likewise MRI scans are generally considered to be valid and reliable measures of brain size though the method of reading the scans may affect their reliability. The most important point is to recognize that any instrument used to measure intelligence may have problems with its validity, an indication of the instrument's appropriateness for measuring the desired variable. Psychologists and other experts in this area are not unified on which, if any, IQ test is an acceptable measure of intelligence. One should therefore limit conclusions to statements about FSIQ scores and not intelligence.
The protocol for this experiment targeted a specific proportion of the population for the selected sample.
Sample selection
The final sample consisted of 40 right-handed Anglo introductory psychology students who had indicated no history of alcoholism, unconsciousness, brain damage, epilepsy, or heart disease. These subjects were drawn from a larger pool of introductory psychology students with total Scholastic Aptitude Test Scores of ≥ 1350 or ≤ 940 who had agreed to satisfy a course requirement by allowing the administration of four subtests (Vocabulary, Similarities, Block Design, and Picture Completion) of the Wechsler (1981) Adult Intelligence Scale-Revised. With prior approval of the University's research review board, students selected for MRI were required to obtain prorated full-scale IQs of ≥ 130 or ≤ 103, and were equally divided by sex and IQ classification. Willerman et al. (1991)
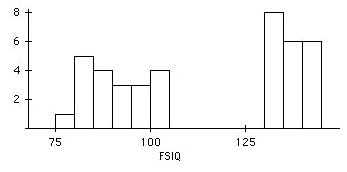
a) What would you expect to discover about the distribution of the FSIQ scores of the selected sample? Construct a histogram of the variable FSIQ to illustrate your claim.
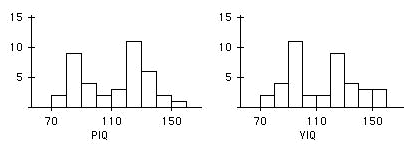
b) What do you expect to see in histograms of the variables VIQ and PIQ? Are they consistent with what you observed in Part a?
a) The sample was selected so that half of the subjects had FSIQ scores at or below 103 while the other half had scores at or above 130. The histogram that follows illustrates the presence of two clusters of observations and the division between them.
b) Both of the histograms below are bimodal but do not have the same separation between the two groups. This result is expected since the FSIQ score is a combination of the PIQ and VIQ scores.
The researchers state that other studies have shown moderate correlations between brain size and body size.
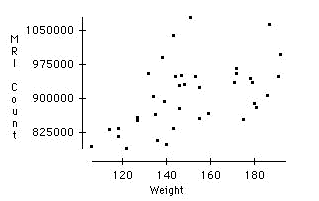
a) Make a scatterplot of weight versus MRI Count. What can you say about the relationship between these two variables?
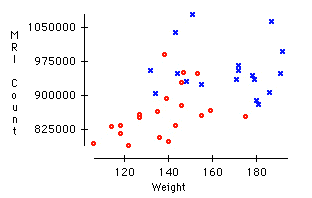
b) What can you say about the relationship between MRI Count and weight when the males and the females in the study are considered separately?
c) Compute the overall correlation between MRI Count and weight as well as the corresponding correlations for males and females separately. Do they confirm your answers to Parts a and b?
d) Can you explain why the overall correlation from Part a is larger than both of the correlations from Part b?
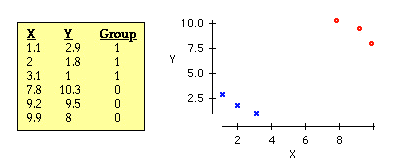
e) Try to construct a data set in which the overall correlation is positive while the correlation of individual clusters of the data is negative. What statistical phenomenon is related to this occurrence?
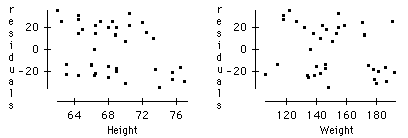
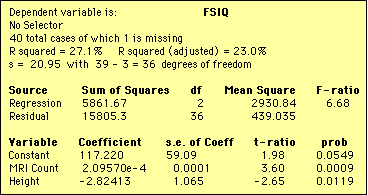
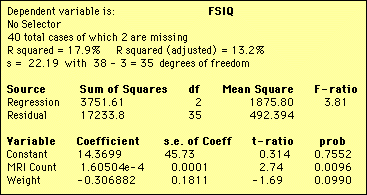
Projects
1) Read Gould (1981) and explore some of the measurement issues he raises. This is a very readable book on the topic of the (mis)measurement in intelligence. Discuss other studies that use modern technology to address similar investigations on relationships between physical characteristics and intelligence. Have these studies eliminated the problems associated with the earlier studies?
2) Find a simple measure of some kind of intelligence, such as the time required to complete a maze or the number of puzzles correctly completed in a fixed period of time. Find an appropriate sample and administer this test. Record information about each subject that you think might pertain to brain size, such as gender, age, body weight, body height, head diameter, or head circumference. Analyze the associations between these variables and the score on your intelligence measure.
References
Gould, S. J. (1981)
Wechsler, D. (1981)
Willerman, L., Shultz, R., Rutledge, J. N., and Bigler, E. (1991)
Credits
This story was prepared by Greg Elfring and last modified on 5/25/94. Thanks to Dr. Lee Willeman,
Department of Psychology, University of Texas at Austin for providing the data.