
Introduction
Probabilities are sometimes reported in advertisements or by the press to convince the reader that a particular outcome is unusual or interesting. Unfortunately, the probability calculations are not always correct. We give some examples in the following pages.
Synopsis
Abstract
This story provides examples of probability statements that are made in the popular press – often in error.
Extensions
Video clip, project ideas.
11 Questions
Calculating probabilities, law of averages, independence, combinatorial problems, conditional probability, Bayes’ Rule.
Basic: Q1–8
Semi-Tech: Q9–11
Results
Little Caesars’ Pizza
During the Summer of 1994, Little Caesars’ Pizza televised an advertisement promoting a “new deal” on their pizzas (see video). For a single price one could order 2 pizzas each with up to 5 toppings. The toppings need not be the same on each pizza.
The commercial proposed two different answers for the number of possible orders for someone taking advantage of this sale: 10 and 1,048,576 were indicated as the correct number of possible orders (note that 1,048,576 = 2 to the power of 20).
It’s a Boy!
On December 26, 1991 the Associated Press reported what they considered to be a rather unusual happening at the Canton-Potsdam Hospital in Potsdam, NY. According to the report, between the dates of December 15 and December 21, all of the sixteen children born were boys. The report further commented that “…the chance of having 16 consecutive births of the same sex is about one in 65000.”
Rolling Elevens
In his book, Pay The Line!, John Gollehon, a noted writer on casino games, makes the following statement about throwing 11’s in the dice game Craps.
“Suppose you threw the dice and 11 came up three times in a row! The odds of that happening are a staggering 4,913 to 1 (17 x 17 x 17 to 1). Now, what do you think the odds are that you’ll throw another 11?
If you’ve already thrown three 11’s in a row, the odds that you’ll throw another 11 are the same as at any other time – 17 to 1! Surprised? Don’t be.”
Gollehon earlier noted that the odds against throwing an 11 on a single throw of two dice are 17 to 1.
The War on Terror
Since the September 11, 2001 terrorist attacks on the United States, the country has been waging a global war on terror. This includes not only military action in Afghanistan and Iraq, but also screening and surveillance procedures within America’s borders. While the ethics, morality, and legality of the tightened security in the U.S. has been hotly debated, the likelihood of its success has not. Savage and Wainer use probability to examine whether or not such tactics can be effective. Specifically, they look at the use of wiretapping potential terrorists living in the United States. Under different assumptions regarding the prevalence of terrorists living within the borders and the ability of such wiretaps to correctly identify terrorists and non-terrorists, the authors calculate the conditional probability of a false positive, which in this case is the incorrect classification of a non-terrorist as a terrorist.
Consider the following example explored by Savage and Wainer. Suppose that the government has compiled a list of potential terrorists, where 1 out of every 100 people on the list actually is a terrorist. Suppose that the government wiretaps these individuals and employs a terrorist detection system with the following properties: 90% of all terrorists will be correctly identified as terrorists by the detection system, while 10% of all non-terrorists (among the list of potential terrorists) will be incorrectly identified as terrorists. (Government officials could claim 90% accuracy, as 90% of all terrorists examined will be caught by the detection system.) The article claims that the probability that someone is not a terrorist given that the detection system identifies the individual as a terrorist is 0.917. In the following questions, we will explore how the authors came up with this number.
Questions
a) This question refers to Little Caesars' "new deal."
A telephone call to a Little Caesars' Pizza store in Columbus, OH revealed that the store carried 11 different types of toppings:
pepperoni, sausage, beef topping, ham, bacon, onion, green pepper,
mushroom, pineapple, hot pepper, and olives. (no anchovies!)
How many ways are there to order a single pizza with "up to 5 toppings" from this list (extra cheese and double toppings are not allowed)?
b) How many ways are there to order two pizzas, one large and one small, with up to 5 toppings on each? ("Do you have to pick the same toppings on each pizza? No!") How is the fact that the pizzas are different sizes important for your calculation? Explain.
a) "Up to five toppings" means choosing 0, 1, 2, 3, 4, or 5 toppings from the 11 listed.
0 toppings (11 choose 0) =
= 1 order.
1 topping (11 choose 1) =
= 11 orders.
2 toppings (11 choose 2) =
= 55 orders.
3 toppings (11 choose 3) =
= 165 orders.
4 toppings (11 choose 4) =
= 330 orders.
5 toppings (11 choose 5) =
= 462 orders.
Thus there are a total of 1024 possible orders.
b) Since the two pizzas are different sizes, each of the 1024 different ways to order a large pizza may be paired with any of the 1024 different ways to order the small pizza. This yields a total of (1024)2 = 1,048,576 unique orders. Note that this number is the answer offered by the "Math Wiz" in the commercial.
If the pizzas are the same size (which is usually the case at Little Caesars’) one would need to eliminate all of the duplicate orders. This is addressed in the next question.
a)This question refers to Little Caesars' "new deal."
Suppose there were only 3 available toppings (pepperoni, mushroom, and onion) and that the "deal" was that one could order 2 pizzas each having up to one topping. If we make the more reasonable assumption that there is no uniqueness among pizzas, how many different orders are there? List all of the possible orders for this case.
b) Using the reasonable assumption that there is no uniqueness among pizzas, how many different orders are there under the conditions of Little Caesars' "new deal" (i.e. 2 pizzas with up to 5 toppings each with 11 toppings to choose from)?
c) Which of the two answers given in the commercial (10 or 1,048,576) is in the same "ballpark" as your answer to Part b?
a)Using the letters c, p, m, and o to represent respectively no toppings (cheese only), pepperoni, mushroom, and onion illustrates that there are four unique ways to order each pizza. The table below groups each of the four choices for the second pizza (PizzaB) with the four ways to order the first pizza (PizzaA).
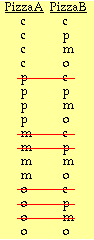
Eliminating the duplicate orders yields the following combinations:
| c,c | c,p |
c,m |
c,o |
= 4 orders |
|
p,p |
p,m |
p,o |
= 3 orders |
|
|
m,m |
m,o |
= 2 orders |
|
|
|
o,o |
= 1 order |
|
|
|
|
10 orders |
Thus there are 10 possible orders.
b) Accounting for repeat orders in this case would appear to be a daunting task as the possibilities seem "endless." The calculation is greatly simplified, however, if one extends the system used in Part a.
The solution to Question 1 states that there are 1024 unique ways to order a single pizza. Therefore the first choice for PizzaA may be combined with any of the 1024 choices for PizzaB. A second choice for PizzaA would allow only 1023 choices for PizzaB (as one combination would be a duplicate order). A third choice for PizzaA would allow only 1022 choices for PizzaB (as two combinations would be duplicate orderes). On the 1024th choice for PizzaA there would only be one choice for PizzaB which would not be a duplicate order.
| Thus the number of different orders | = 1024+1023+1022+ ... + 2 + 1 |
| = |
c) Even though the "Math Wiz" answer of 1,048,576 appears more plausible than 10 it is interesting to note that 1,048,576 − 524,800 = 523,776 while 524,800 − 10 = 524,790. Both answers are off by roughly the same order of magnitude.
This question refers to the It's a Boy! anecdote:
On December 26, 1991 the Associated Press reported what they considered to be a rather unusual happening at the Canton-Potsdam Hospital in Potsdam, NY. According to the report, between the dates of December 15 and December 21, all of the sixteen children born were boys. The report further commented that “…the chance of having 16 consecutive births of the same sex is about one in 65000.”
a) Do a calculation to see whether you agree with the statement in the Associated Press article that "...the chance of having 16 consecutive births of the same sex is about one in 65000." Ignore the possibility of identical twin births. Does your result agree with that given in the article?
b) Why would the calculation be more difficult if we did not ignore the possibility of multiple, identical births?
c) Where do you think the Associated Press erred?
d) Keeping in mind that the Associated Press is a national news agency, do you think that the event they reported was rare? That is, how often would such an event occur in the United States? Explain your reasoning.
a) Let us first define the event A as follows.
A = The event that 16 consecutive births are of the same sex.
Note that
Pr(A) = Pr(16 consecutive boy births) + Pr(16 consecutive girl births)
Assuming the probability that a single birth is a boy is equal to the probability that a single birth is a girl is equal to 0.5, and that the sex of each child born is independent of the sex of all other children born, we find that
P(A) = (0.5)16 + (0.5)16 = 2(0.5)16 = (0.5)15 = 1/32,768
So the Associated Press article seems to be off by a factor of two.
b) If we don't ignore the possibility of multiple, identical births, we couldn't make the assumption that the sex of each child born at the hospital is independent of the sex of all other children born.
c) It is likely the Associated Press erred in that it gave the probability of 16 consecutive boys (or of 16 consecutive girls) being born. Notice that
Pr(16 consecutive births are boys) = (0.5)16 = 1/65,536.
d) There are many hospitals in the U.S. where children are born. If you pick a sequence of 16 births in a row, the expected number of single-sex outcomes in the next 16 births at all U.S. hospital is
(# of hospitals) ×1/65,536.
Since there are so many hospitals in the U.S., such an event is probably not a rare one for the nation.
This question refers to the It's a Boy! anecdote:
On December 26, 1991 the Associated Press reported what they considered to be a rather unusual happening at the Canton-Potsdam Hospital in Potsdam, NY. According to the report, between the dates of December 15 and December 21, all of the sixteen children born were boys. The report further commented that “…the chance of having 16 consecutive births of the same sex is about one in 65000.”
It was also explained in the article that two days before the report appeared, all five newborns at the Canton-Potsdam Hospital had been girls. Does this demonstrate the Law of Averages at work? Why or why not?
This question refers to the Rolling Elevens anecdote:
In his book, Pay The Line!, John Gollehon, a noted writer on casino games, makes the following statement about throwing 11’s in the dice game Craps.
“Suppose you threw the dice and 11 came up three times in a row! The odds of that happening are a staggering 4,913 to 1 (17 x 17 x 17 to 1). Now, what do you think the odds are that you’ll throw another 11?
If you’ve already thrown three 11’s in a row, the odds that you’ll throw another 11 are the same as at any other time – 17 to 1! Surprised? Don’t be.”
Gollehon earlier noted that the odds against throwing an 11 on a single throw of two dice are 17 to 1.
The odds of an event is defined as the probability of the event happening divided by the probability of the event not happening, or
odds of an event = P( Event occurs)/P(Event does not occur)
odds against an event = P( Event does not occur)/P(Event occurs)
Gamblers are usually interested in the odds against the event they are betting on, because that determines the payoff if they win. Calculate the odds against throwing an 11 in a single throw of two dice. Was Gollehon's calculation correct?
We first calculate the probabilities of the event and its complement.
P(roll an 11) =
![]()
= 2/36 = 1/18
and
P(do not roll an 11) = 1−P(roll an 11) = 17/18
Therefore we have
odds against an 11 = ![]() = 17/1 (read 17 to 1).
= 17/1 (read 17 to 1).
So Gollehon was correct in his calculation of the odds against throwing an 11 in a single roll of two dice (although he mislabeled it as the "odds of throwing an 11").
This question refers to the Rolling Elevens anecdote:
In his book, Pay The Line!, John Gollehon, a noted writer on casino games, makes the following statement about throwing 11’s in the dice game Craps.
“Suppose you threw the dice and 11 came up three times in a row! The odds of that happening are a staggering 4,913 to 1 (17 x 17 x 17 to 1). Now, what do you think the odds are that you’ll throw another 11?
If you’ve already thrown three 11’s in a row, the odds that you’ll throw another 11 are the same as at any other time – 17 to 1! Surprised? Don’t be.”
Gollehon earlier noted that the odds against throwing an 11 on a single throw of two dice are 17 to 1.
Calculate the odds of throwing three 11's in a row. Was Gollehon's calculation correct? Why or why not?
Once again we calculate the probabilities of the event and its complement. However, we note that we do not have the same event as before! We also note that the three tosses of the dice are independent, so
P(roll 3 consecutive 11's)
= P(11 on the first roll and 11 on the second roll and 11 on the third roll)
= P(11 on the first roll) × P(11 on the second roll) × P(11on the third roll)
= (1/18) × (1/18) × (1/18) = 1/(5832)
Then P(do not roll 3 consecutive 11's) = 1 − 1/(5832) = 5831/5832
Therefore, the odds against 3 consecutive 11's are
odds against 3 consecutive 11's =![]() = 5831/1 (read 5831 to 1).
= 5831/1 (read 5831 to 1).
Gollehon's calculation was incorrect. He multiplied the odds rather than the probabilities.
This question refers to the Rolling Elevens anecdote:
In his book, Pay The Line!, John Gollehon, a noted writer on casino games, makes the following statement about throwing 11’s in the dice game Craps.
“Suppose you threw the dice and 11 came up three times in a row! The odds of that happening are a staggering 4,913 to 1 (17 x 17 x 17 to 1). Now, what do you think the odds are that you’ll throw another 11?
If you’ve already thrown three 11’s in a row, the odds that you’ll throw another 11 are the same as at any other time – 17 to 1! Surprised? Don’t be.”
Gollehon earlier noted that the odds against throwing an 11 on a single throw of two dice are 17 to 1.
To see how astray Gollehon's "method" of multiplying odds can lead, consider the tossing of a fair coin in which the probability of tossing heads is 1/2. Calculate the odds of getting heads on a single toss, then calculate the odds of getting heads on 10 tosses in a row using both Gollehon's "method" and the correct method. Comment on the results.
P(getting heads on a single toss) = 1/2
P(not getting heads on a single toss) = 1/2
odds =![]() = 1 (read 1 to 1)
= 1 (read 1 to 1)
P(getting 10 consecutive heads) = (1/2)10 = 1/1024
P(not getting 10 consecutive heads) = 1 − 1/1024 = 1023/1024
odds = ![]() = 1023 (read 1023 to 1).
= 1023 (read 1023 to 1).
Using Gollehon's "method" the odds of getting 10 consecutive heads are 1 to 1 (1 × 1 × 1 × 1 × 1 × 1 × 1 × 1 × 1 × 1 to 1). In other words, the chances of getting 10 consecutive heads are the same as the chances of getting heads on a single toss! This is, of course, ridiculous.
This question refers to the Rolling Elevens anecdote:
In his book, Pay The Line!, John Gollehon, a noted writer on casino games, makes the following statement about throwing 11’s in the dice game Craps.
“Suppose you threw the dice and 11 came up three times in a row! The odds of that happening are a staggering 4,913 to 1 (17 x 17 x 17 to 1). Now, what do you think the odds are that you’ll throw another 11?
If you’ve already thrown three 11’s in a row, the odds that you’ll throw another 11 are the same as at any other time – 17 to 1! Surprised? Don’t be.”
Gollehon earlier noted that the odds against throwing an 11 on a single throw of two dice are 17 to 1.
Is Gollehon's final statement correct? That is, given the fact that you've already rolled three consecutive 11's, the odds against rolling an 11 on the next roll are 17 to 1. Is this true?
The statement is true, since each of the rolls of the dice are independent (although again he confuses the odds against an event with the odds for the event).
a) This question refers to the War on Terror anecdote:
We will use Bayes’ Theorem to see how Savage and Wainer came up with the conditional false positive probability of 0.917. First, given that a non-terrorist undergoes this screening procedure, what is the probability that they are identified as a terrorist?
b) Given that someone is a terrorist, what is the probability that they are identified as a terrorist?
c) Using the answers to part a) and b), use Bayes’ Theorem to calculate the probability that someone is not a terrorist, given that they were identified as a terrorist by the screening device. (This is the “false positive” probability.)
a) P(Individual is identified as a terrorist | Individual is not a terrorist) = 0.10
b) P(Someone is identified as a terrorist | Individual is a terrorist) = 0.90
c) First, we will use a shorthand for the following events:
IT = {Identified as a terrorist by the screening procedure}
T = {Actually is a terrorist}
NT = {Actually is not a terrorist}
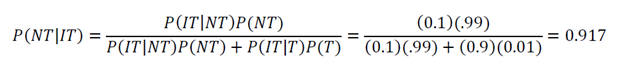
This is in agreement with the result stated in the article.
This question refers to the War on Terror anecdote:
Suppose that, as in Question 9b, we have a 90% accurate terrorist screening procedure. What percentage of all people screened (what percentage of those on the list of possible terrorists) need to actually be terrorists in order to have a false positive rate less than 50%?
Let x = proportion of all screened individuals that are terrorists. We must then solve the equation:
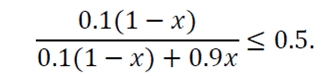
Solving for x yields x ≥ 0.1. So, given a 90% accurate screening procedure, the population of individuals screened must contain at least 10% terrorists.
This question refers to the War on Terror anecdote:
Suppose that the FBI announces a new terrorist screening procedure that is 90% accurate, and that among the people screened, 1 out of every 100 are actually terrorists. Your neighbor is identified as a terrorist, and your other neighbor proclaims, “He more than likely is a terrorist! The FBI’s screening procedure is 90% accurate.” Why is your neighbor’s reasoning flawed?
Conditional on your neighbor being identified as a terrorist, we can see, using Questions 9 and 10, that the probability that he is not actually a terrorist is over 0.91. So, even though the screening procedure is fairly accurate, there is a very good chance that your neighbor has been incorrectly identified and is a false positive.
Projects
References
The Columbus Dispatch (December 26, 1991)
Gollehon, J. (1988)
Savage, S., Wainer, H. (2008), “Until Proven Guilty: False Positives and the War on Terror”, Chance, 21 (1), 55 – 58.
Credits
The story was prepared by Mark Zabel on 5/3/95. It was last updated by Josh Svenson on January 7, 2009. “Math Wiz” c. 1994 Little Caesar Enterprises, Inc. used with permission.