Fig 3E.2 - Intermolecular Potential Energy
The Lennard-Jones potential is an approximation to the true intermolecular potential energy curves. It models the attractive component by a contribution that is proportional to 1/r6, and the repulsive component by a contribution that is proportional to 1/r12. Specifically, these choices result in the Lennard-Jones (12,6)-potential.
Although there are good theoretical reasons for these choices, there is plenty of evidence to show that 1/r12 is only a very poor approximation to the repulsive part of the curve.
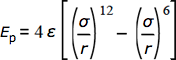
The formula is
Where ε (kJ·mol-1) is the depth of the well, σ (pm) the separation at which Ep = 0, and r is the separation in picometers.
To graph the potential (kJ·mol-1) enter ε, σ and click New Plot. Up to 5 plots can be displayed at one time. The Clear button will remove all plots. To see the parameters for each plot click the Legend button. The Redraw button will refresh the graph. This is useful when the function domain (i.e., r ) has been changed. To see the value of each plot at a given point, move your cursor to the desired location then click.