Fig 4H.1 - The Entropy from the Heat Capacity
The change in molar entropy of a sample with temperature may be determined from the temperature dependence of the molar heat capacity, CP,m. The procedure involves plotting CP,m / T against T and determining the area under the curve. The molar heat capacity of all solids decreases towards zero as the temperature is reduced.
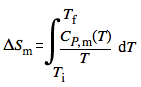
We suppose that the measurements are conducted under constant pressure and that the sample does not undergo a phase transition. The change in molar entropy between two temperatures is then
We write the temperature dependence of the constant-pressure molar heat capacity
CP,m = a + b·T + c/T2
Where CP,m is molar heat capacity (J·K-1·mol-1), T is the temperature (kelvin), and a, b, and c are empirical parameters.
To graph molar heat capacity (and the change in molar entropy) enter a, b, c and click New Plot.
Up to 5 plots can be displayed at one time. The Clear button will remove all plots. To
see the parameters for each plot click the Legend button. The Redraw button
will refresh the graph. This is useful when the function domain (i.e., T ) has been changed. To
see the value of each plot at a given point, move your cursor to the desired location then
click. Toggle between a plot of CP,m against T or CP,m/T against T or the integral of
CP,m/T by clicking its radio button.